What FSM does and doesn’t, tell us about pupil disadvantage
30th May 2015
- It overlooks many of the most disadvantaged pupils
-
It does not capture all elements of disadvantage
-
It may put increasing pressure on schools as the economy emerges from recession.
There is therefore an urgent need for better, more accessible data on the real circumstances affecting disadvantaged pupils and their families.
1. Who is eligible and who is claiming?
Even if we define disadvantage narrowly as ‘coming from a low income family’, the FSM/non-FSM distinction doesn’t neatly overlap with pupils who are more or less disadvantaged. Despite being described as a measure of ‘Free School Meal eligibility’, the FSM measure actually only captures those who claim Free School Meals – rather than those who would be eligible if you assessed their income.
FSM’s ability to capture pupil-level disadvantage is therefore hampered by incomplete uptake. A 2007 study for example, found that 22% of FSM children’s families have incomes above £200 per week, and 20% of non-FSM children have incomes below £200 per week. More recent research has also shown that FSM pupils will not necessarily be the poorest in their school since income support pushes FSM families’ incomes up so that in some cases it leapfrogs that of parents who narrowly miss out on eligibility.
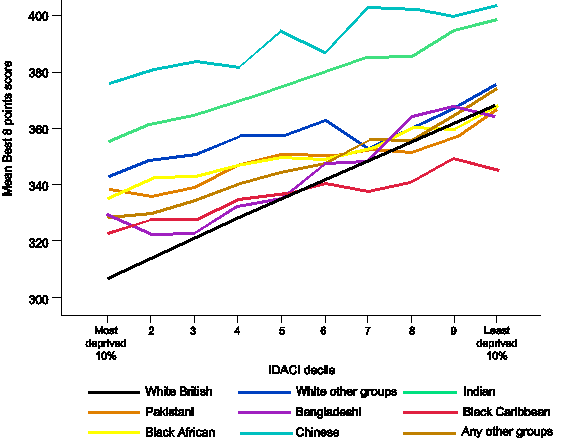
The non-FSM group is also not homogeneous as Becky Allen points out. FSM is a ‘binary’ yes/no measure, unlike something like IDACI which is a continuous, community level variable. The ‘non-FSM’ group therefore lumps together families on the threshold of poverty (but just above eligibility) together with children whose parents earn six-figure salaries. In fact educational attainment varies across the spectrum of deprivation as the graph below highlights.
As Dave’s blog shows, pupils frequently move between eligibility and ineligibility, yet pupils moving out of FSM are likely to continue experiencing disadvantage without the associated funding. The move to an ‘ever6’ measure of disadvantage has gone some way to addressing this but pupils will nonetheless move out of eligibility over the course of their educational career whilst still being affected by their relative disadvantage – particularly that which they have accrued over their crucial early years.
What sort of disadvantage are we talking about?
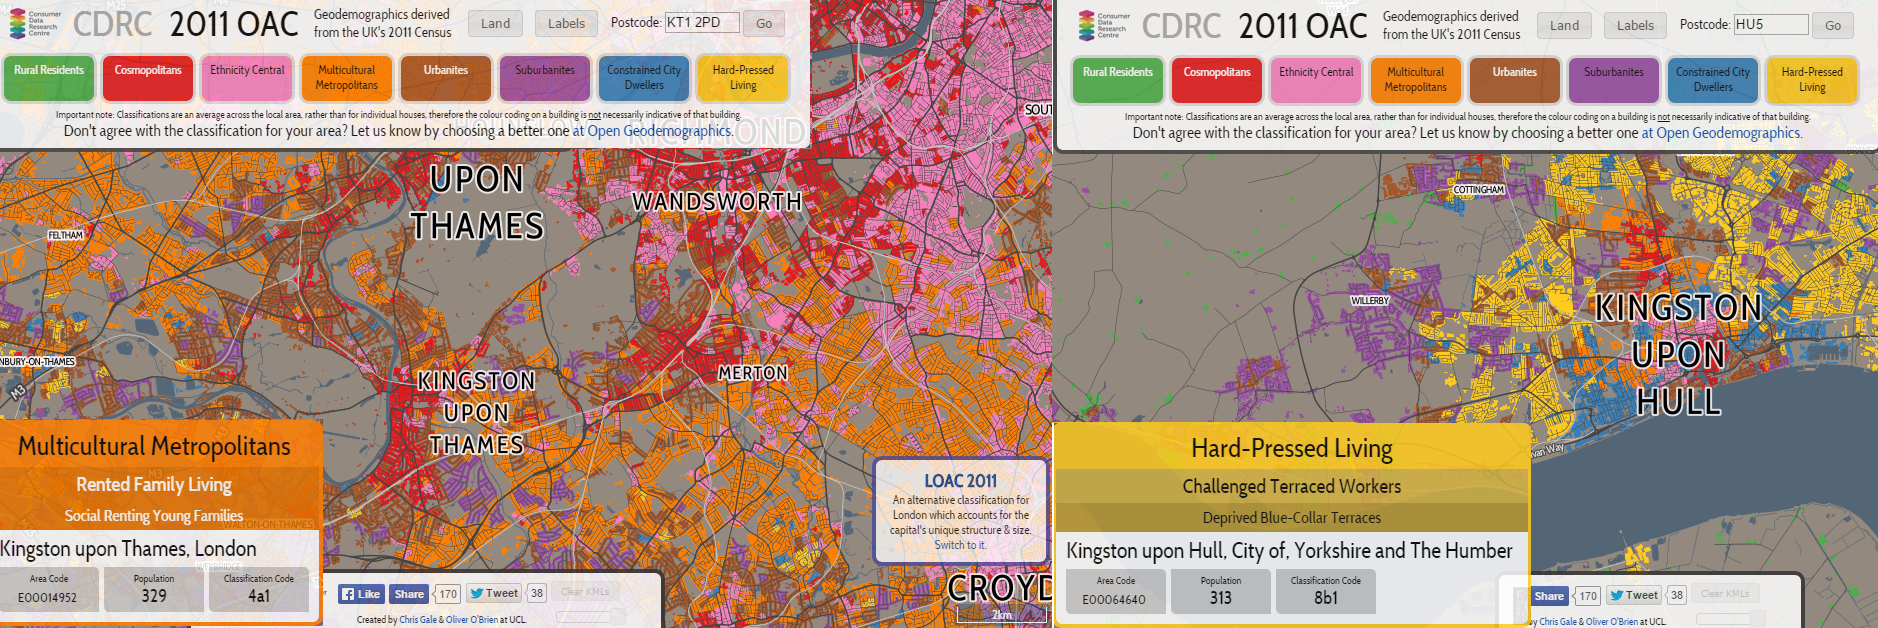
Income and socioeconomic status are not the same thing, and this is made clear when comparing the characteristics of FSM pupils across regions: In London, many FSM pupils are from low income but highly skilled families. They may have access to other resources too including professional, university-educated friends and acquaintances that can be of benefit to children’s education. Outside London, FSM pupils are more likely to come from low income and low-skilled families with less access to the advantageous capital that can help mitigate the effects of a low income. Comparing a map of Kingston upon Thames (18% FSM at secondary) and Kingston upon Hull (41% FSM at secondary) based on Output Area Characteristics makes this clear- Kingston upon Thames’ 288 secondary school FSM pupils face very different circumstances to Kingston Upon Hull’s 1,043.
Ultimately, parental income and eligibility for certain benefits are not the only factors that affect whether or not a pupil is disadvantaged and this is why socioeconomic background (usually defined by parental occupation and parental education) is a widely used in social research. However, precise information on parents’ educational qualifications, job roles, job security, and skill level cannot be gleaned from administrative data held by government departments. Instead, census or survey data must be used and this is either infrequently gathered or covers only a subset of the population. It is also harder to access and link to educational performance data.
It’s the Economy Stupid!
The impact of recession on employment and wages is likely to have temporarily pushed many families onto low incomes. As the economy and wages (hopefully) recover, these families will return to being non-FSM. As the FSM cohort gradually loses its ‘temporary’ FSM pupils, stubborn poverty and the associated underachievement is likely to become increasingly dominant within the cohort. Given that fewer FSM pupils means less Pupil Premium funding there is a risk that a perfect storm could ensue which puts increasing pressure on schools’ attempts to close the attainment gap.
Given the challenges around the FSM measure outlined above, there is an urgent need for better public data on the full range of disadvantage faced by pupils. Only by making it easier for researchers to explore social and material deprivation can we ensure that the education and youth sector is able to target well informed support where it is needed most.
Comments