Free schools are disproportionately serving more privileged pupils. It’s official
14th May 2013
In 2012, only two Free Schools had a proportion of pupils on Free School Meals that matched their Local Authority. On average 11% of pupils in Free Schools were eligible for Free School Meals compared to 23% in their Local Area, a staggering 12% point difference*. The figures were released following a question to the Minister of State for Schools from Conservative MP, Andrew Griffiths. They starkly reveal the unrepresentative nature of the first tranche of Free Schools.
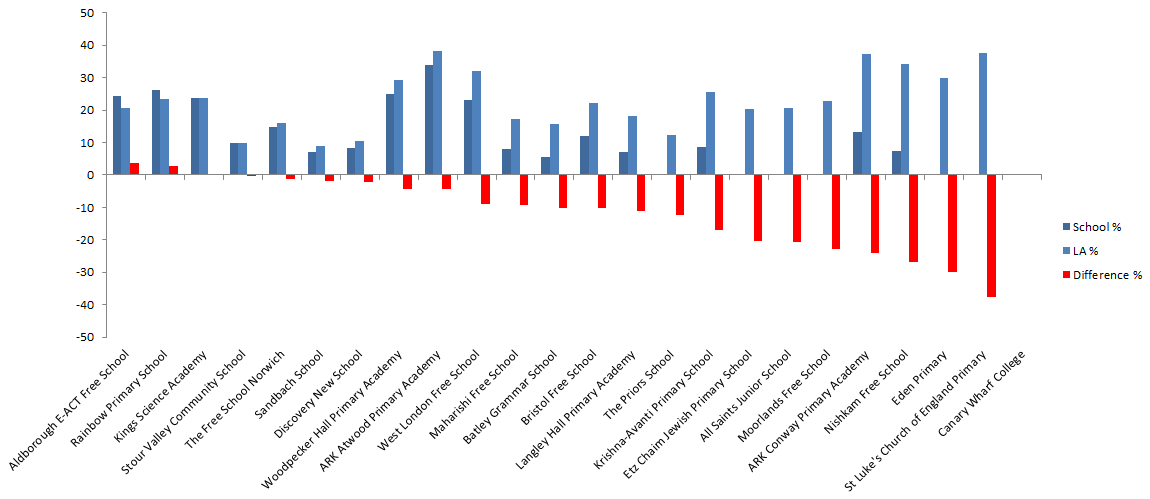
(figures for Canary Wharf College are supressed due to low numbers)
To put it even more dramatically, if we calculate how many FSM pupils we would expect to be taught in Free Schools (based on their LA average), we would expect there to be 609 of them. The actual figure is little over half that: 325.
The official figures will come as no surprise to many: back in 2011, Rachel Gooch contacted the first tranche of Free Schools asking them what proportion of their pupils were eligible for Free school Meals. Her request revealed that disadvantaged pupils were hugely underrepresented in Free Schools. Since then, the DfE and New Schools Network have been battling to mitigate the criticism that the Free Schools policy serves middle class families (and Tory voters) rather than poorer pupils. Guidance on applying for the New Schools’ Network’s Development Program for example states that:
“If you have a compelling case that you are addressing pupils at risk of educational disadvantage this section is worth twice the weighting of other sections. We want to see that disadvantaged pupils are key to your rationale.”
Given this aim, yesterday’s figures lay down the gauntlet for the DfE and New Schools network: Whilst this data only includes the first 24 Free Schools, 2013 figures are due to be released in the next month or so and will include the larger number of schools that opened in September 2012: we can only hope that the figures show an improvement…
Many thanks to our eagle-eyed Policy Development Partner, Laura McInerney for spotting these figures!
A few people have, quite rightly, raised the question of statistical significance. For one thing, because the schools are so small, a low number of additional FSM pupils could push the school above the ‘matching LA average’ threshold, as the following graph shows:
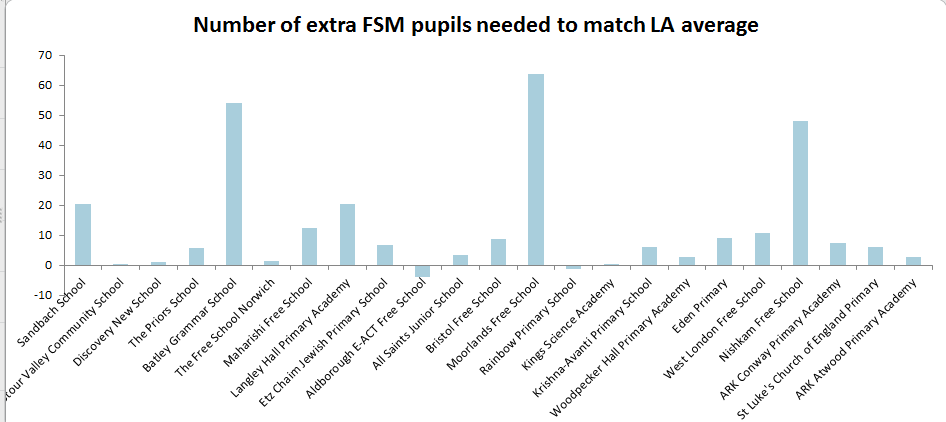
Secondly, it’s a small number of schools.
However, what we can do is ask: ‘Are Free School pupils disproportionately unlikely to be FSM eligible’ by looking at the population of Free School pupils as a whole. Given that we know that 3,487 pupils were attending Free Schools in January 2013 (excluding Canary Wharf College), we can take a random sample of these and see how many were FSM eligible. We can then compare this number to the proportion you would expect to find if Free School pupils were socially representative of their LAs (by calculating how many you would expect to find in each school if it were in line with its LA average).
Picking a sample of 500 Free School pupils gives me 54 FSM pupils and 446 non. You would expect to find 87 FSM pupils and this is a significant difference (p<0.001).
Of course, none of this tells you what will happen in Free Schools in the long term given that wave 1 schools will probably be different to subsequent waves and that the first year of opening a school is also different to other years. Nonetheless, it tells us something quite important about what happened in the first wave of Free Schools.
*Ammendment 14/05/13 – figures updated to take into account the fact that data for one school was suppressed due to low numbers.
Comments