Do struggling schools improve?
6th December 2013
It is an article of faith amongst those of us with a passion for school improvement that schools can improve. It is therefore worrying that research by Andy Smarick and Tom Loveless in America shows only a small proportion of schools achieve turnaround (also here). Having seen so many successful turnarounds, I find Smarick’s work hard to square with my (anecdotal) experience and optimism. I’ve therefore looked at the UK figures to see what story they tell. It turns out that while some schools are transformed, the figures aren’t as positive as I’d hoped, raising tricky questions for what to do about underperforming schools.
I looked at two areas: exam performance (KS2 and 4) and secondary school Ofsteds since 2005 and found:
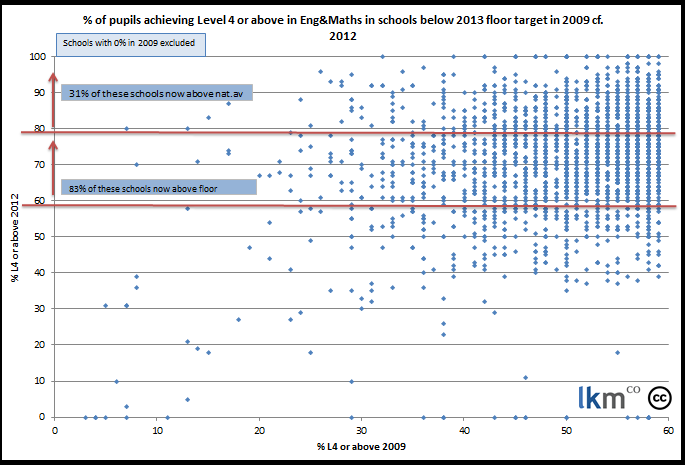
- 83% of primaries below the (current) floor target in 2009 are now above the floor and 31% are at or the above national average.
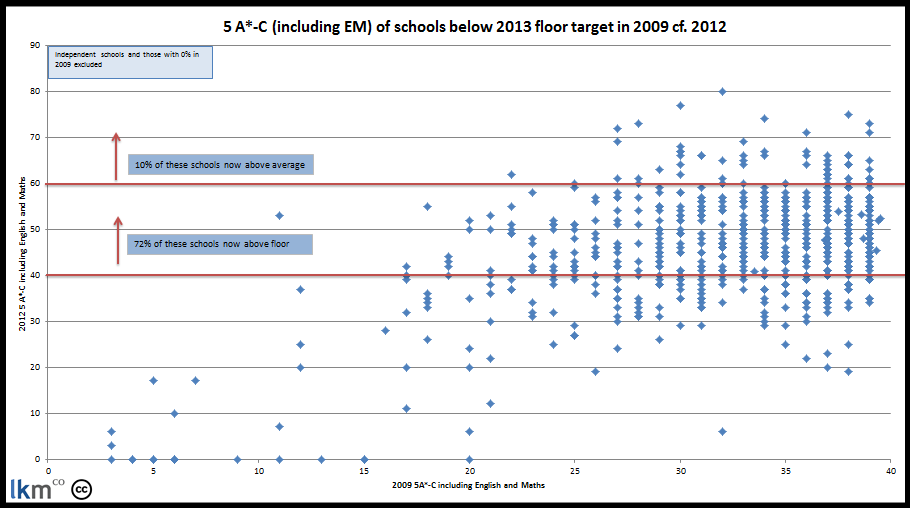
- 72% of secondaries that were below the floor target in 2009 are now above the floor and 10% are at or the above national average.
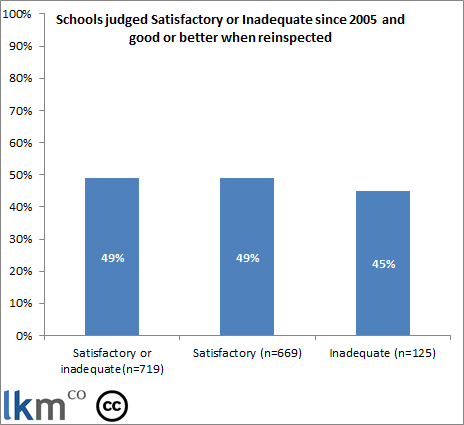
- If you look at secondary schools that were graded less than good and then re-inspected, 49% are now good or better.
What counts as ‘turnaround’ is up for debate and I recognise that the measures I have used here are arbitrary: I have taken the current floor target as a measure of being a struggling or underperforming school and then looked at those which moved from below the floor to above it. Being above the floor target is not the same as having ‘turned around’ so, as a measure of reversing a school’s fortunes I then looked at schools which are now above average. In many ways this is unfair: some serve challenging populations in which above average attainment can be a substantial achievement and three years is a short period anyway. On top of that, we can hardly expect all schools to be ‘above average’. However, these figures give us some indication of which schools have truly transformed their, and their pupils’, fortunes.
The following graph plots primary schools’ 2009 results against their 2012 results. The further left the dot, the worse the schools’ 2009 result. The further up, the higher its current result. The vast majority of these ‘underperforming’ schools have now moved above the floor target whilst a third are now above average.
Sadly, the situation is less positive in secondaries; Although almost three quarters moved above the floor, very few made it to average.
A second measure we can use to balance out the shortcomings of an attainment driven approach is to look at Ofsted inspections. I took all the secondary schools that received an overall grade of less than good and which were then re-inspected, to see what proportion moved to good or above1. Just under half moved from below to above good (and are still there).
Dividing this group according to those deemed satisfactory (or ‘requires improvement’) and those deemed inadequate shows there was not a great deal of difference between the two groups’ movement to good+2.
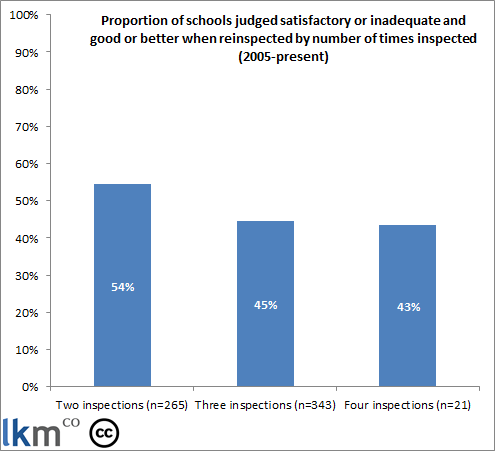
Given that some schools were inspected more than twice, I also looked at how schools’ chances of moving out of ‘sub-good’ changed as the number of times they were graded less than good increased. I.E., was a school less likely to turn around once it had been judged less than good twice? There was not much difference here either, in fact, those found to be less than good more than once were just as likely, if not more so, to be judged good+ in their next inspection.
Overall, it seems my instinct that schools can turn around was correct. However, the odds seem to be heavily stacked against these schools. Despite my desire for this not be the case, it leaves me wondering how and when we should make the decision to call time on a struggling school…
Notes:
1. Here we are looking at the current grade of all secondary schools that received a grade of less than good during any inspection since 2005. Some schools will have been inspected more than twice and moved in and out of the ‘sub-good’ category.
2. Some schools were judged satisfactory, then inadequate and then good+ (or inadequate-satisfactory/RQ then good+), these were therefore counted in both the Sat/RQ and Inadequate categories.


Comments