Kick a dog when it’s down: Fining schools for struggling
25th August 2015
Today’s Policy Exchange Report argues for fining schools when pupils do not achieve a C in English and Maths in order to better fund Further Education (FE) colleges. Actually, that’s how it’s been spun, really what I think they’re trying to say is that funding should be transferred from Secondary school budgets to FE. Which is a bit more sensible. But it’s still not very sensible.
If you accept, (as Policy Exchange does), that the overall amount of funding for education is not going to increase, they are quite right to ask how should the money best be distributed in order to best support those who need it most. However, the question should have led PX to consider who would suffer most from their proposal and if these were really the schools that needed the money least. Unfortunately they didn’t look into this, and Jonathan Simons explains that this is because data is not yet available on which schools would be ‘rescued’ by the Progress 8 condition attached to the policy according to which schools would only have to pay the ‘fines’ if their pupils had made low progress. I therefore decided to take a look at who might face the highest fines.
From the 3,028 mainstream secondary schools for whom I could find full data I excluded schools with a high proportion of pupils with Special Educational Needs (SEN) (30% or more) – since PX have rightly said schools should not be fined for SEN pupils. This gave me 2,017 secondary schools.
I then identified those with low GCSE results (43% or fewer achieving 5A*-C including English &Maths). This gave me 385 schools. I then applied an approximation ofPX’s Progress 8 ‘get-out clause’ by excluding schools with a value added score of 995 or above.
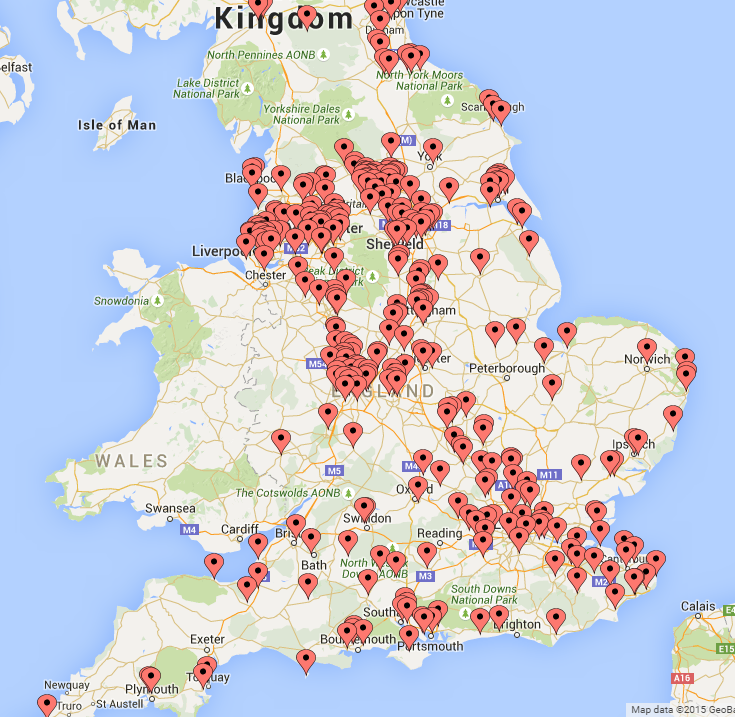
This ‘rescued’ 58 schools leaving 327 schools. These may well be the schools that suffer most from Policy Exchange’s proposal. You can find them here: http://lkm.li/KickaDogMap
In these schools, an average of 41% of pupils are disadvantaged, 55% more than in the original set of 2,017 mainstream schools. There are clusters of them in Birmingham, London and in a belt running from Manchester to Hull. They also line the English coastline. I find the schools map particularly interesting when you look at it side by side with a map of child poverty in the UK.

I struggle to believe that they are the schools that need the money the least and find it even harder to believe that the best way to help these schools improve is to take a large chunk of their budget away from them. Jonathan argues that it is the principle that matters; I’d say that the principle of not kicking a dog when it’s down is a better one.
Most of these schools gain a lot from the pupil premium policy, a measure Policy Exchange were instrumental in securing – it is strange to see them give with one hand and take with the other.
NB: I absolutely recognise that the way I’ve looked at this data leaves a lot to be desired and I’m sure organisations like datalab will be able to do it properly.
1. Best 8 Value added is not the same as progress 8,
2. 5A* including E&M is not the same as ‘less than a C in English and Maths’
3. I have looked at all of this data at school rather than individual level. Nonetheless, these schools are still likely to be some of the biggest losers from the proposed policy.
Comments