The School Experience: Ofsted Parent View and a different kind of variation
by Loic Menzies
9th June 2020
At the end of May, the government provided an update on the latest ‘Parent View’ statistics from Ofsted. The figures reveal a range of trends which I summarise here in seven graphs.
There are positive findings on special schools, curriculum and parental engagement alongside some more worrying figures on perceptions of pupil safety and an alarming dip in parents’ opinions of their child’s school between primary and secondary.
1. Caveats
Although the data is based on a nearly a quarter of a million parents’ submissions, this is still a response rate of only 2.6% in maintained schools and academies. Furthermore, when looking at school level data, results for any school with fewer than ten submissions have been suppressed.
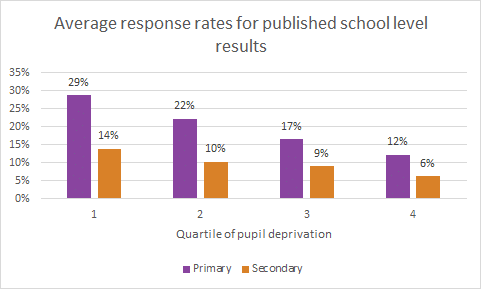
The parents who chose to respond are highly unlikely to be representative of parents as a whole, with results at the extremes likely to be exaggerated. Schools also vary in the extent to which they push encourage parents to respond and as the graph below shows, average response rates vary dramatically by school type and level of deprivation.
An additional caveat is that in order to distinguish trends, in this analysis I have, for the most part, used the proportion of parents ‘strongly agreeing’ with statements, which makes results look more negative than they would be if parents ‘agreeing’ were also included.
The reason for this is that I am not looking to gauge overall levels of satisfaction, rather we are looking at variation, which is clearer when using the more granular ‘strongly agree’ responses than the ‘zoomed out’ combined agree/strongly agree responses.
2. Special schools and nurseries stand out
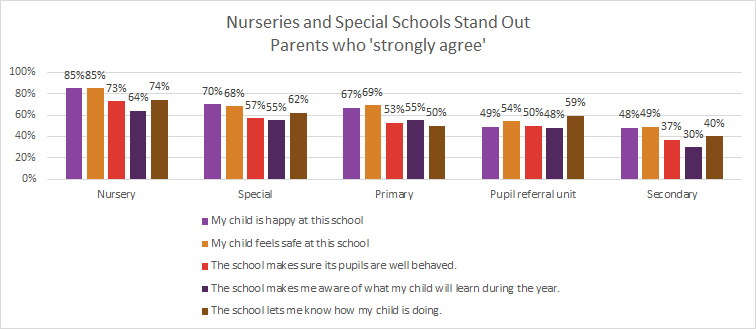
The proportion of parents who ‘strongly agree’ that their child is happy, safe, and that the school communicates with them, is particularly high in special schools and nurseries, which is great to see.
3. Secondary school tail off
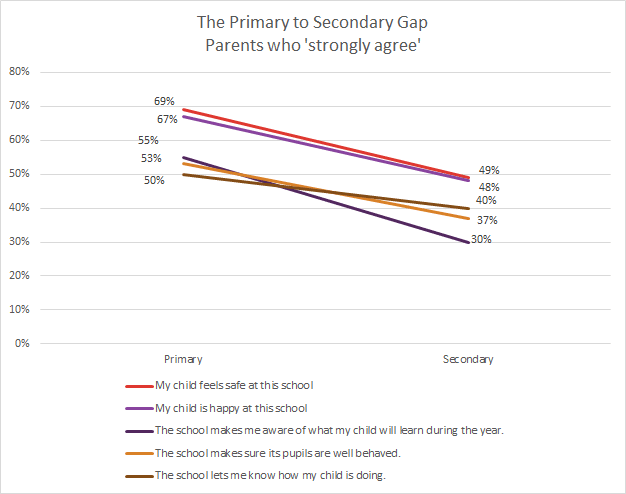
In numerous areas, satisfaction seems to tail off, quite substantially in some cases at secondary school level. Perhaps the most dramatic drop off is in pupil happiness, with the proportion of parents saying their child is happy at school dropping from over two-thirds to under half.
Of course, this is unlikely to be entirely (or even largely) down to the school with teenagers facing all sorts of challenges at this age. However, combined with figures showing a very similar drop in the proportion of parents strongly agreeing that their child feels safe in school – its clear that something is going wrong, with one in ten parents at secondary school level explicitly saying that their child does not feel safe in school. The unrepresentative sample makes it hard to draw conclusions, but it is clear that too many pupils feel unsafe at school.
The poverty gap – mixed findings in school
3. The learning environment
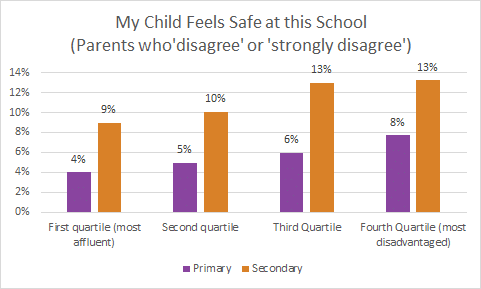
Unfortunately the picture on safety gets worse when we cut results by disadvantage (classifying schools into quartiles of disadvantage based on the proportion of pupils eligible for pupil premium, combining primary, secondary and special schools).
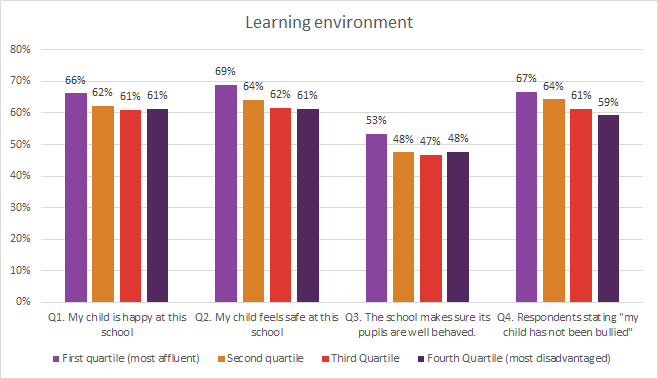
Although we are using results for ‘strongly agree’, the figures for parents ‘disagreeing’ or ‘strongly disagreeing’ that their child feels safe in school suggest that in the most disadvantaged secondaries, more than one in ten pupils’ parents (13%) do not think their child feels safe at school. Whilst I think it’s important to restate the caveats about the unrepresentative samples, these results are nevertheless concerning, a safe environment is surely a critical foundation for any school.
The latest @ofstednews data doesn't paint a pretty picture on pupil safety and behaviour Share on X
4. Parental engagement and school communication
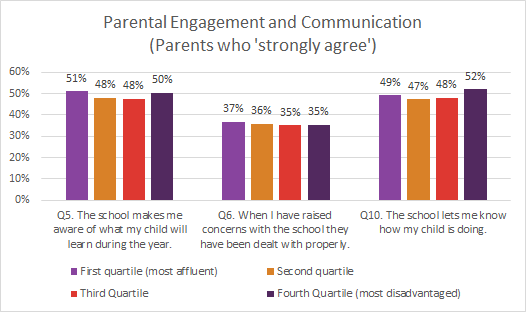
Although figures for both ‘sharing what pupils will be learning’, and ‘how pupils are doing’ are stuck at an average of ~50% across all schools, the gaps linked to pupil population characteristics are smaller.
Results for question 6 on schools responding to parents’ concerns look bad but this is because many respondents selected “I have not raised any concerns”.
5. Curriculum and Wider Development
Research suggests that access to subjects like music, art and drama has dwindled, perhaps due to a combination of recruitment difficulties, real-term funding cuts and increasing curriculum demands. For now though, this does not seem to have led to a steep socio-economic gradient in parents’ sense that there is a good range of subjects available, though of course, it could be that cut-backs have affected all schools, regardless of their intake and a ~50% figure for parents strongly agreeing that there is a good range available is certainly not as high as one might hope.
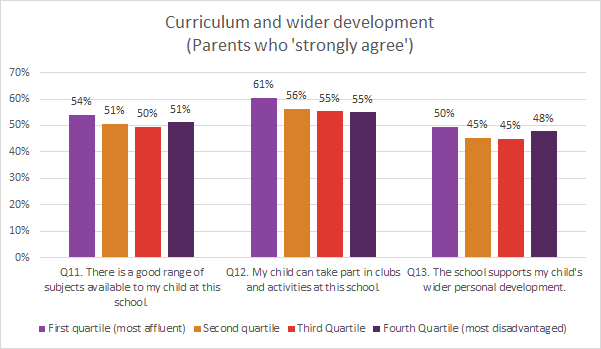
Similarly, there have also been concerns that increasing curriculum demands, combined with pressure to close the attainment gap could lead to a reduced focus on wider personal development. Again, Parent View does not suggest that this leading to disparities depending on pupil intake. On the other hand, only around half of parents told Ofsted that they ‘strongly agreed’ that the school supports their child’s wider personal development.
Results relating to access to clubs and activities are much more striking (and worrying) when it comes to socio-economic gradient (Q12 above). Parents of pupils in the most disadvantaged schools are 10% less likely to strongly agree that their child is able to take part in clubs and activities, a finding corroborated by my own research using a unique, large dataset to demonstrate that poor pupils face a “double disadvantage” when it comes to accessing enriching activities and experiences.
Parents of pupils in the most disadvantaged schools are 10% less likely to strongly agree that their child is able to take part in clubs and activities according to data from @ofstednews Share on X6. Expectations and Satisfaction
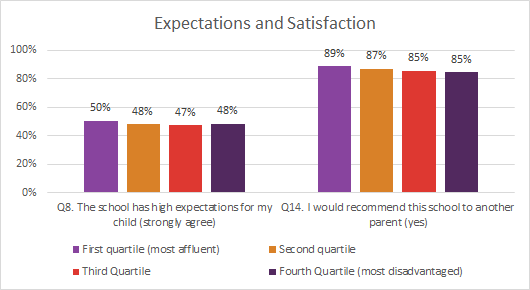
Findings are once again mixed when it comes to expectations and satisfaction. Whilst unfortunately only half of parents strongly agree that their school has high expectations of their child, 85-90% would recommend the school, a figure that provides a pretty positive conclusion overall.
NB: updated lunchtime 9th June to correct some figures


Hi Loic, you state that “results at the extremes likely to be exaggerated” yet you choose to focus almost exclusively on results from one extreme (“strongly agree”) in all measures. Not only does that seem contradictory, it also obscures the fact that many parents who took the trouble to respond may also have taken the trouble to give balanced judgements of complex and subjective issues. It overlooks the fact that many parents have more than one child at the school and may have received very different, even conflicting, impressions through those children’s time in the school, forcing a mixed or moderate conclusion towards the centre of the scale. Moreover, the final observation (85-90% would recommend the school), which flies in the face of the interpretations you’ve given to all the others, receives no analysis at all. I’m very puzzled but, at the same time, sending you my best wishes.
Hi Barney,
Just posting my response as per our discussion on twitter.
Thanks so much for the comment and just to restate- the reason for running the analysis this way is that I was primarily trying to explore variation rather than overall satisfaction, and thus needed a granular measure.
I hoped I could clarify and provide balance by including this para: “The reason for this is that I am not looking to gauge overall levels of satisfaction, rather we are looking at variation, which is clearer when using the more granular ‘strongly agree’ responses than the ‘zoomed out’ combined agree/strongly agree responses” + the overall satisfaction level figure at the end that.