Wilshaw, data dashboards and governors: Why it matters.
26th February 2013
Tomorrow morning, the Chief Inspector of Schools, Michael Wilshaw is expected to unveil the new, two-page data dashboard for governors. It will summarise key information to support governors in challenging and holding leadership to account. This is a welcome development.
Back in 2009, the Education White Paper defined the role of governing bodies as “holding the school’s leadership to account for the performance of the school.” It argued that they should do this by “making effective use of data and information to manage performance” In 2011 LKMco carried out a study for Teach First on what makes good governance for schools in challenging circumstances. Two thirds of interviewees referenced the importance of data with one describing the ability to analyse data as “absolutely key” for governors. It is only fair that governors have the tools they need to fulfill their role given that inspections will now place much more emphasis on governance. Yet we found that data was one of the most challenging areas for governors due to difficulties in accessing, presenting and using it. In this blog I argue that Ofsted’s dashboard could potentially overcome two of these issues but that the third remains.
Firstly, governors rely on those they hold to account, for the information which they are expected to use in doing so. That may sound odd and circular but that’s because it is: Leadership teams give governors information and governors use that to hold them to account. I’m sure in the vast majority of cases this is not a problem but it is an odd dynamic and one that is open to ‘creative use’ where governors do not know the full range of information that is available. It was Heads themselves who raised this issue most during our interviews. As one put it:
“the amount of data that is available in any school is phenomenal and heads can choose which data they share with governors and which they don’t”
By independently providing key information to governors, Ofsted’s dashboard makes things far more sensible.
The second issue is that, when governors get hold of data, it needs to be in a comprehensible form. I recently counted 361 fields of information in just one page from a ninety-four page Raise Online report: try using that to manage performance without being a fulltime expert. Ofsted’s new dashboard promises to make governors’ jobs that bit easier by presenting a summary which points governors to the key areas they should be paying attention to. What will make a difference to how successful the dashboard is will be:
- How the dashboard balances the need for simplicity and depth: For example, Ofsted’s dashboard does not include any information about finances, the Value Added Best 8 measure (which is important given recent reforms), or progress by those in different attainment bands at entry. This may be good in terms of keeping things simple but could also be just a bit too shallow.
- How clearly and visually it presents information: It looks pretty good to me on this- but then I spend a lot of time looking at data.
- Whether it is able to pinpoint the particular issues that should be top of the agenda for individual schools: It does this to a certain extent, flagging up FSM gaps for example, but issues with exclusion rates amongst particular groups of students and gender based attainment gaps may be relevant in some schools.)
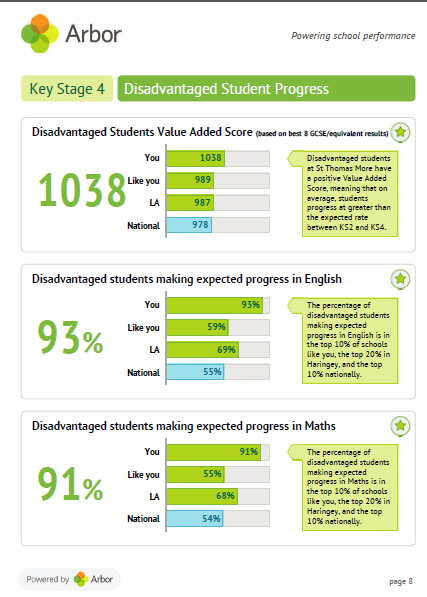
Working with Arbor Education Partners we have developed a free summary school report. which has been distributed to 1000s of schools. Feedback from Heads and governors has been extremely positive. The two main principles behind it were the need to have a clear, visual design and the need for benchmarks. The latter is also a feature of the Ofsted dashboard and its importance should not be underestimated. Governors often only interact with one school and they need a sense of what other schools are achieving if they are to know what is possible; that low achieving pupils on entry need not inevitably mean low attainment at exit, for example. Benchmarked data gives governors the tools to ask “how can we too achieve this (or better)?”
We are now working on a series of other reports on several other key issues for schools.
Nonetheless, there is still one step to go before governors can use data effectively. Our research included a case study of governing body undertaking a self-audit. They considered availability of data one of their strengths but their ability to use it was an area for development. Several governors we spoke to raised this issue:
“I wonder if you asked most governors in the country in let’s say a primary school, how are your year 3 girls are doing, or in a secondary school; how did your year 9’s do in history, how many year 10’s are on target to meet their target GSCE grades? I think a relatively small proportion, certainly far smaller than it should be, could actually say this, this, this. And that’s quite worrying and if they can’t do it and they’re not challenging on those figures, there’s not going to be anyone else who is”
A Head teacher echoed this view suggesting that good governors need the skill to:
“see through the bullshit. I think schools are very good at telling a story of success of glowing victory and things and I think that there needs to be a level of knowledge about some of the things that schools do to make sure they look good…head teachers, the executive function of an organisation always want to tell the governors of that organisation that they are doing a good job. I think that dynamic sometimes means that there is a degree of opaque bullshit that goes on.”
Professor Chris James’ extensive research on governance came to similar conclusions. He showed that “where governing had failed in the past, the evidence indicated that the governing body processes, particularly scrutiny of performance data –were inadequate”. In contrast “some of the governing bodies gained significant benefit from individual governors who had a fascination with data…”
Ultimately, once they have got the information, the onus is still on governors to spot the stories it tells and to know what questions to ask. If it is done well, opening up school data through Ofsted and Arbor’s new reports will overcome two of the three main barriers that stand in the way of effective data use by governors: availability and presentation. However, governors still need the training and practice which will help them put these powerful tools to good use.

Read our report on school governance
Download an example Arbor school report
Comments