Winners and Losers on the New Progress 8 Measures
13th October 2016
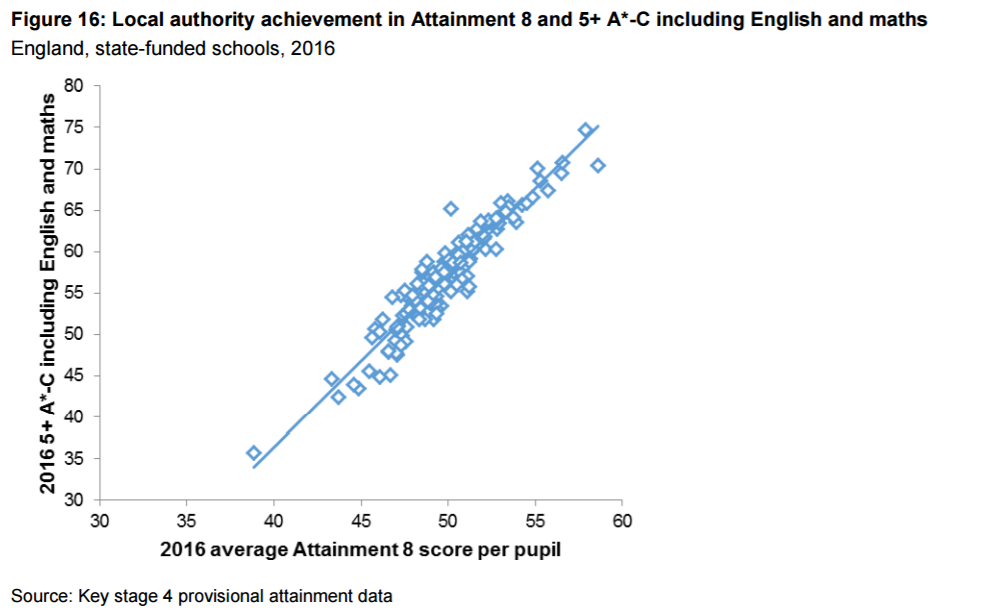
Today’s provisional GCSE data release from the DfE includes brand new Progress 8 statistics and some useful comparisons between old and new measures. On page 25 for example, the DfE compares Attainment 8 and 5+ A*-Cs including English and Maths. It concludes “there is a high level of correlation between the two measures.”
However, this might not be the case when looking at the relationship between A*-C E&M and Progress 8.
In theory at least, pupils could enter secondary school with very poor performance but make excellent progress. Conversely they might achieve highly due to strong prior attainment despite poor progress.
A moderate relationship
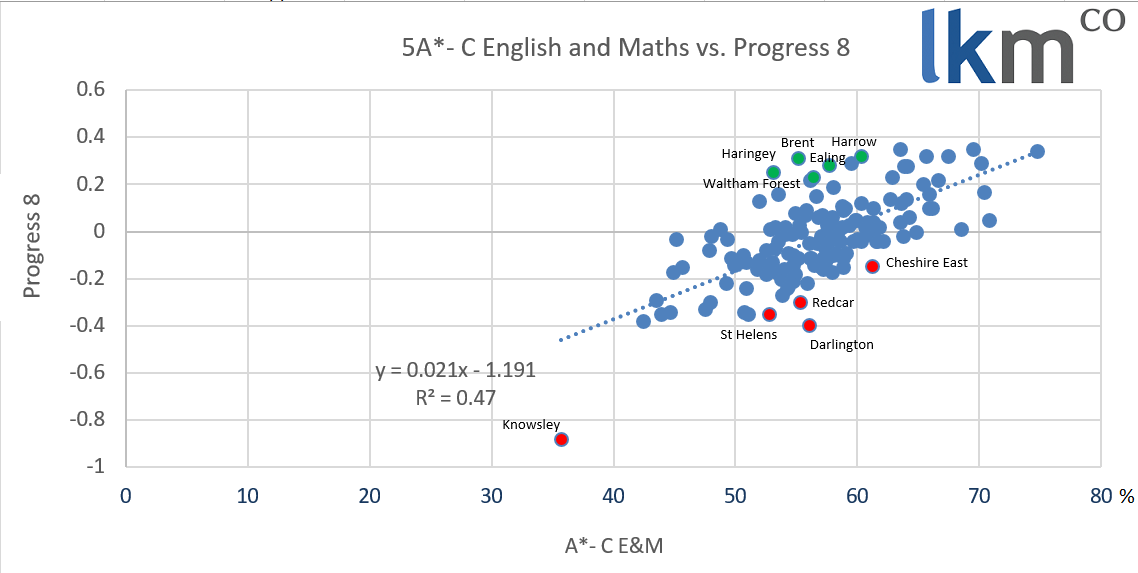
In fact, the correlation between Progress 8 and attainment 5A-C E&M is still moderate (R2 = 0.47), despite being much lower than between Achievement 8 and 5A-C E&M. In other words, Progress 8 tends to be higher in areas where attainment is higher and vice versa. However, some areas buck the trend and do better or worse than might be expected. This raises the question ‘who are the outliers?’ In other words, where do pupils making strikingly high or low levels of progress (taking into account overall attainment).
Contrasting pupil trajectories
Comparing LAs’ actual Progress 8 scores with their expected P8 score (given by the formula of the regression line) reveals a clear contrast between different areas. In some (such as Redcar and Cleveland, Knowsley and Darlington) poor progress is somewhat masked by attainment levels. In others (like Harrow, Brent, Ealing and Haringey), progress is surprisingly high. Noticeably these positive outliers are all London boroughs and, (with the exception of Haringey), in outer-London. It might therefore be helpful to add controls to take into account EAL or migration status, factors that might supress KS2 scores and inflate Progress 8.
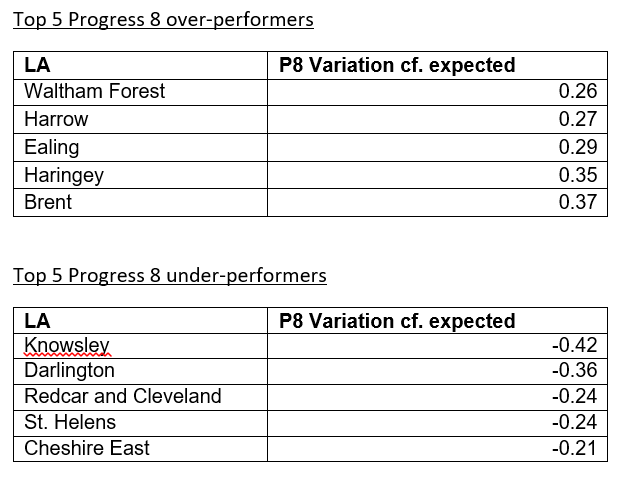
Progress 8 reveals that areas like Harrow and Cheshire East may have similar 5A*-C E&M scores (60.3% and 61.2% respectively) but very different levels of progress. Comparing the measures in this way adds to the case for further work investigating London’s success, as well as additional work to tackle geographical cold spots – both topics we are excited to be working on at LKMco at the moment.
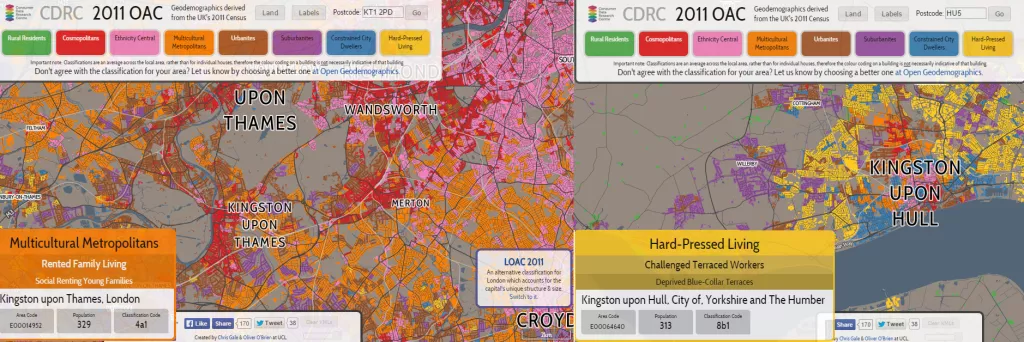 For more on the contrasting fates of different areas check out our piece on Kingston upon Hull v. Kingston upon Thames
Comments